Showing posts with label Climate Change. Show all posts

Friday, 29 March 2013

Small volcanoes make big impact on climate

It’s getting warmer, but not as fast as climate models earlier predicted. Airborne particles from volcanic activity might help explain why.

Over the past decade, the climate has not warmed as swiftly as global climate models predicted, but it hasn’t been clear what factors might be tamping down the warming. Some experts point to increased industrial emissions of sulfur dioxide from coal burning over China and India.

 Others have wondered whether sulfur emissions from volcanic activity could also play a role. However, it’s long been thought that only colossal volcanic events such as the 1991 Mt. Pinatubo eruption could release a sizable enough quantity of sulfur dioxide to affect the climate.

Astronauts aboard the International Space Station captured this striking view of Sarychev Volcano (on Kuril Islands, northeast of Japan) beginning to erupt on June 12, 2009. New research shows that even relatively small-scale volcanic eruptions can influence global climate. Image credit: NASA

A study recently published in Geophysical Research Letters has shown that small- to moderate-size volcanoes, rather than industrial emissions over Asia, have helped slow down warming over the last decade. The cooling effect of these volcanic sulfate particles, known as aerosols, has counterbalanced about 25% of the expected warming over the last decade. The study’s multi-institutional team was led by Ryan Neely, an atmospheric scientist at NCAR who began the project while at the University of Colorado Boulder (CU-Boulder).

Sulfate aerosol forms naturally in a layer of the atmosphere known as the stratosphere, which begins above the height at which commercial airliners fly. The stratospheric aerosol layer plays an important role in balancing the heat of Earth’s atmosphere as the particles act like a mirror, reflecting light back into space and preventing some of the Sun’s energy from penetrating the troposphere, where we experience weather.

Previous research indicates that the stratospheric aerosol layer has increased by 4–10% per year since 2000. But there have been conflicting theories about the source of that increase. One study suggested that this growth in stratospheric aerosol originated in China and India due to their proximity to the Asian monsoon, which can fast-track pollution upward, creating a so-called “gateway” to the stratosphere.

However, recent satellite observations have linked the growth in the aerosol layer to emissions from relatively small and frequent volcanic eruptions.

To parse the individual contributions of aerosol from industrial emissions and volcanoes, Neely and his colleagues used an array of observations, ranging from satellites to first-hand accounts, to compile data on volcanic activity across the globe over the last decade. They then turned to a new database of volcanic sulfur dioxide emissions as well as inventories of emissions from industrial activity in Asia, inputting that information into a computer model of global climate. Their work included a detailed analysis of the aerosol properties.

When they compared the model output to satellite observations, “It was clear that the volcanoes had the larger impact,” Neely says. “The anthropogenic emissions, though much larger than the amount of sulfur emitted by the volcanoes, had little or no impact on the region we looked at in this study.”

Neely cautions that, while the new study shows the importance of volcanoes on a decadal level, there is a need to learn more about their effects on year-to-year climate variability as well. “Though we show that volcanoes had the most impact in this instance, this has not and may not always be true,” he says.

Via NCAR | UCAR

Wednesday, 20 March 2013

February 2013 was ninth warmest February on record

Globally, last below-average temps for February were in 1976. Last below-average month was December 1984. If you’re 27 or younger, no month of your life has had below-average temps.

According to the National Oceanic and Atmospheric Administration’s National Climatic Data Center, February 2013 was the 9th-warmest February on record for the globe, tying 2003 at 0.57°C (1.03°F) above the 20th century average of 12.1°C (53.9°F). The global land surface temperatures tied with 2010 as the 11th-warmest February on record. Meanwhile, February global sea surface temperatures were ranked as the 8th-warmest February on record. If you combine the global land and ocean average temperatures together during the period from December 2012 through February 2013, you will find that it was the 12th such warmest period on record. In this post, we will look at the events that took place in February 2013 and show where the warmest/coolest temperatures occurred across the globe and who received the most/least amount of rainfall.

Global land and ocean temperature anomalies for February 2013. Image Credit: NOAA/NCDC

As you can see in the above image, temperatures were above average across Mexico, northwestern Canada, parts of Greenland, northeastern Africa, the Middle East, and Southeast Asia. Temperatures were cooler than average in the southwestern United States, western Europe, Mongolia, eastern Siberia, and Alaska for February 2013. Australia observed its record warmest summer (December-February) ever recorded. According to the Australian Bureau of Meteorology, the average maximum summer temperature was 1.44°C (2.59°F) above the 1961–1990 average, easily beating the previous record set in 1982/83 by 0.21°C (0.38°F).

It is important to note that the last time we had below-average temperatures in the month of February globally was in 1976, and the last below-average month of any kind was December 1984. With this in mind, if you are 27 years old or younger, no month of your life has had below-average temps.

Land only precipitation percentiles for February 2013. Image via NOAA/NCDC

The southeastern United States and north-central India experienced some of the wettest weather across the globe in February 2013. Record dryness occurred over most of Chile, parts of northern Africa, northern Philippines, and in parts of far western Australia. In New Zealand, many areas saw very little rainfall for the month. In fact, Northland, Auckland, and the Bay of Plenty received less than 15 percent of normal precipitation for the month. Meanwhile, Australia saw rainfall that was around 78 percent of average. Some coastal areas did experience plenty of rainfall thanks to various slow moving storm systems. For instance, Tropical Cyclone Rusty brought monthly rainfall in parts of northwestern Australia that was in the highest 10 percent for February. Northern Pakistan experienced so much rain in early February that some areas received totals typically seen for the entire month in just three days.

The MODIS instrument aboard NASA’s Aqua satellite acquired this visible image on February 26. It shows the eye of Tropical Cyclone Rusty very close to making landfall near Port Hedland, Western Australia. Image via NASA Goddard MODIS Rapid Response Team.

According to the National Snow and Ice Data Center, the average Arctic sea ice extent for February 2013 was 14.66 million square kilometers (5.66 million square miles). This is 980,000 square kilometers (378,000 square miles) below the 1979 to 2000 average for the month, and is the 7th-lowest February extent in the satellite record. Through 2013, the linear rate of decline for February ice extent is -2.9% per decade relative to the 1979 to 2000 average.

Image via NOAA

Meanwhile, in Antarctica, sea ice extent was 25.9 percent above the 1980-2010 average. This makes it the 3rd-largest sea ice extent on record. Monthly average sea ice extent for February 2013 was 3.83 million square kilometers (1.48 million square miles) and minimum daily sea ice extent for the Antarctic region was 3.68 million square kilometers (1.42 million square miles) on February 20, 2013. According to the NSIDC, unusual circulation patterns, likely resulting from higher-than-average pressure in the Bellingshausen Sea, pushed sea ice in the northwestern Weddell Sea far to the north. Amazing … especially since February is summer for Antarctica.


Map for February 2013 via NOAA/NCDC. View larger.

Bottom line: February 2013 was the 9th-warmest February on record globally. The combined global land and ocean average temperatures during the period from December 2012 through February 2013 was the 12th such warmest period on record. Arctic sea ice extent was ranked as the 7th-lowest February extent in the satellite era. Meanwhile, Antarctica experienced the the 3rd-largest sea ice extent on record.


- EarthSky

Monday, 18 March 2013

In a Warming World, the Storms May Be Fewer But Stronger (Final Part)

  1. References

  2. Brooks, H. (2013, April 1) Severe thunderstorms and climate change. Atmospheric Research. Volume 123, Pages 129-138.
  3. Climate Central (2013, Jan. 11) U.S. Sets Record for Days Without a Deadly Tornado. Accessed March 1, 2013.
  4. Cooney, C. (2012, Jan. 1) Downscaling Climate Models: Sharpening the Focus on Local-Level Changes. Environmental Health Perspectives. Volume 120, Number 1.
  5. Del Genio, A. (2007, Aug. 17) Will moist convection be stronger in a warmer climate? Geophysical Research Letters. Volume 34, Number 16.
  6. Del Genio, A. (2011, April 16) Will a Warmer World Be Stormier? Earthzine. Accessed March 1, 2013.
  7. Diffenbaugh, N. (2012, Dec. 19) Does Global Warming Influence Tornado Activity? EOS. Volume 89, Number 53.
  8. Emanuel, K. (2005, Aug. 4) Increasing destructiveness of tropical cyclones over the past 30 years. Nature. Volume, 436, Pages 686-688.
  9. Francis, J. (2012, March 17) Evidence linking Arctic amplification to extreme weather in mid-latitudes. Geophysical Research Letters. Volume 36, Number 6.
  10. Kishtawal, C. (2012, May 26) Tropical cyclone intensification trends during satellite era (1986-2010). Geophysical Research Letters. Volume 39, Number 10.
  11. Knutson, T. (2010, Feb. 21) Tropical cyclones and climate change. Nature Geoscience. Volume 3, Pages 157-163.
  12. Knutson, T. (2008, May 18) Simulated reduction in Atlantic hurricane frequency under twenty-first-century conditions. Nature Geoscience. Volume 1, Pages 359-364.
  13. Kunkel, K. (2012) Monitoring and Understanding Trends in Extreme Storms: State of the Knowledge. Bulletin of the American Meteorological Society.
  14. Kunkel, K. (2010, Dec. 23) Recent increase in U.S. heavy precipitation associated with tropical cyclones. Geophysical Research Letters. Volume 37, Number 24.
  15. Lau, W. and Zhou, Y. (2012, March 17) Observed recent trends in tropical cyclone rainfall over the North Atlantic and North Pacific.Journal of Geophysical Research Atmospheres. Volume 117, Number D3.
  16. Masters, J. (2008, May 21) The future of wind shear. Accessed March 1, 2013.
  17. Pryor, S. (2008, March 28). How spatially coherent and statistically robust are temporal changes in extreme precipitation in the contiguous USA? International Journal of Climatology. Volume 29, Number 1.
  18. Shepherd, M. (2012, Oct. 31) Hurricane Sandy and Climate Change. Project Syndicate. Accessed March 1, 2013.
  19. Slate (2012, Oct. 29) Hybrid Hell. Accessed March 1, 2013.
  20. Trapp, R. (2007, Dec. 4) Changes in severe thunderstorm environment frequency during the 21st century caused by anthropogenically enhanced global radiative forcing. PNAS. Volume 104, Number 50.
  21. Trapp, R. (2010, May 10) Regional climate of hazardous convective weather through high-resolution downscaling. Climate Dynamics. Volume 37, Number 3-4.
  22. Vecchi, G. and Soden, B. (2007, April 18) Increased tropical Atlantic wind shear in model projections of global warming. Geophysical Research Letters, Volume 34, Number 8.

- NASA

Sunday, 17 March 2013

In a Warming World, the Storms May Be Fewer But Stronger (Part 5)

Can Models Provide an Answer?

Due to gaps and limitations in historical records of storms, some scientists have turned to general circulation models (GCMs) for answers. GCMs are computer models that divide the globe up into three-dimensional grids, with the side of each box typically representing about 150 to 200 kilometers (90 to 125 miles) of the Earth. The conditions within each box are defined by equations that depict features of the oceans and atmosphere, such as temperature, humidity, pressure, and wind. The models also include factors that can affect those features, such as the concentration of greenhouse gases, the reflectivity of Earth’s surface, or the distribution of clouds or aerosols.


New, high-resolution computer models are increasingly capable of resolving small features in the atmosphere. The GEOS-5 model, running at a resolution of 3.5 kilometers (2.2 miles) per grid cell, simulated the state of the atmosphere on January 2, 2009. (NASA image by Greg Shirah, GSFC Scientific Visualization Studio.)

Models are useful because they make it possible to parse out how each different factor might influence climate in a given location. By adding, removing, and adjusting the variables, scientists can develop a deeper understanding of how the many pieces of the climate puzzle fit together.

“Models allow us to test hypotheses and improve our understanding in ways that no other type of experiment can,” says Del Genio. “They are criticized for predicting things ‘wrong’ and for the lack of agreement between them. But a model simulation that predicts something incorrectly can be just as useful for revealing underlying processes as a model run that gets the ‘right’ answer.”

Climate models are quite good at working out features of the atmosphere on a broad scale, and they do a reasonably good job of simulating large extra-tropical cyclones, which can stretch hundreds of kilometers. But they struggle to simulate hurricanes or thunderstorms, and they cannot produce key details (such as the heaviest bands of wind and rain) in extra-tropical storms. Hurricanes are generally about 150 kilometers (90 miles) across; an individual thunderstorm is usually less than 10 kilometers (6 miles). Both are smaller than the typical grid boxes in a climate model.

Thunderstorms are smaller than the resolution of a typical global climate model. However, a new generation of regional models that include high-resolution, real-world data now provide scientists with a detailed look at thunderstorms and other small-scale features of the atmosphere. (Astronaut photograph ISS022-E-006510.)


To address this problem, climate modelers have started to develop a new generation of models that reduce the size of the boxes in key regions by “downscaling.” One way they do this is by adding very detailed information about something that’s well known, like topography, into a low-resolution climate model. They also add ever-more detailed information from real-world satellites.

“Downscaling to simulate storms is a bit like knowing that you have a low-resolution image of a face that’s so blurry you can hardly tell what it is,” explained Gavin Schmidt, a climate modeler at NASA’s Goddard Institute of Space Studies. “You take clues from a low-resolution image and then map them with other information about things like eye color, skin colors, and nose shapes to construct a more reasonable image of what the face really looks like.”

Trapp’s research group at Purdue, for example, used downscaling to incorporate data from a coarse climate model into a finer-resolution weather forecasting model. This made it possible to resolve some individual thunderstorms in the central United States and even some of the smaller elements of storms. Overall, the model captured daily rainfall patterns with surprising accuracy over a ten-year period.

“No model can predict the future perfectly,” says Del Genio. “But there’s no question that models are helping us with the underlying science.”

In some cases, the work has just begun. While climatologists have extensively studied tropical storms, they’ve hardly studied some of the more exotic types of storms. Sandy, for example, began in the Caribbean as a typical tropical storm but then morphed into a “hybrid” with extra-tropical characteristics. While tropical cyclones draw their energy from warm ocean waters, extra-tropical cyclones are fueled by sharp temperature differences between fronts in the atmosphere. Sandy was able to tap energy from both sources, which is part of the reason it was so destructive.

“No model can predict the future perfectly,” says Del Genio. “But there’s no question that models are helping us with the underlying science.” (Photograph courtesy Anthony Del Genio, NASA Goddard Institute of Space Studies.)

Shepherd does think warming had an influence on Sandy, but he advises against rushing to judgment. “We do not know whether superstorms like Sandy are harbingers of a ‘new normal’, he says. “It’s a bit like steroids usage and home run statistics for baseball. Some influence was surely there, but we have more work to do before we can say precisely what percentage of home runs were helped by steroids.”

And then, of course, the inherent variability of the oceans and atmosphere means storm trends don’t follow straightforward patterns. After the record-shattering tornado outbreaks of 2011, for instance, the year 2012 was unusually quiet.

“There was a strong impulse to over-interpret and attribute tornadoes to climate change in 2011,” says Del Genio. “2012 was a good reminder that we can’t do that. We have to be patient if we really want to understand the relationship between storms and climate. The attribution is about trends and understanding underlying processes. It is not about flagging individual events with some sort of scarlet letter.”

- NASA

Final part to be published on the 18 March 2013.

Monday, 11 March 2013

In a Warming World, the Storms May Be Fewer But Stronger (Part 3)

Effects of the Temperature See-Saw

If understanding the impact of global warming on storms were simply a matter of tallying up extra moisture, the answer would be pretty straightforward. However, reality is more complicated. Putting extra water vapor into the atmosphere is just one of the ways global warming is changing the planet. Another important factor is how the heat in the atmosphere is distributed.

Since the mid Twentieth Century, average global temperatures have warmed about 0.6°C (1.1°F), but the warming has not occurred equally everywhere. Temperatures have increased about twice as fast in the Arctic as in the mid-latitudes. The loss of sea ice is a key reason why. Bright and reflective ice is giving way to darker, open ocean—amplifying the warming trend by absorbing more heat from the Sun. On the other hand, the abundance of convection and thunderstorms in the tropics contributes to a slower rate of warming by transporting heat away from the surface.


Global temperatures from 2000–2009 were on average about 0.6°C higher than they were from 1951–1980. The Arctic, however, was about 2°C warmer. (NASA image by Robert Simmon, with GISS Surface Temperature Analysis (GISTEMP) data.)

Climatologists think the differing rates of warming from the equator to the poles could have a significant impact on some types of storms. Extra-tropical cyclones, for example, harvest energy from the atmosphere when masses of warm and cold air interact along the polar front—the boundary between cooler polar air and warmer subtropical air. As the difference between the temperature at the poles and the tropics decreases, there could be less energy for these storms to absorb, a change that could weaken them or make them less frequent.


Temperatures are warming more near the poles than near the equator. This plot shows the change in temperature versus latitude from 1880 to 2012. The reduced temperature contrast between high latitudes and the tropics likely weakens extra tropical cyclones. (NASA image by Robert Simmon, with GISS Surface Temperature Analysis (GISTEMP) data.)

“Sorting out opposing factors is what makes this such a challenging problem,” Del Genio says. “And keep in mind that this is a simplification. These aren’t the only two factors involved.”

Wind shear—a measure of how the speed and direction of winds differ at different levels of the atmosphere—complicates the picture because it can affect storms in a variety of ways. Tropical cyclones require weak wind shear; in other words, they need minimal differences in wind speeds at adjacent levels of the atmosphere. Strong wind shear tears tropical cyclones apart, preventing heat and moisture from organizing into a storm core.

Research suggests that Atlantic wind shear could increase by 1 to 2 miles (1.6 to 3.2 kilometers) per hour for each degree that global temperatures increase. It’s this potential increase that explains why many climate simulators conclude that the number of tropical cyclones will stay the same or decrease even as the strongest storms get stronger. An article published in 2010 by a group of the world’s leading storm experts concluded that the average intensity of tropical cyclones will likely increase by 2 to 11 percent by 2100, but the overall frequency of storms will decrease between 6 and 34 percent.
Hurricane Felix hovers over the Caribbean Sea, as viewed from the International Space Station on September 3, 2007. (Astronaut photograph ISS015-E-25054.)

Another complicating factor is that the same changes in equator-to-pole temperatures that could influence storm formation could also affect the winds that steer them. For instance, jet streams—meandering streams of fast-moving air that play a key role in steering storms—could speed up or slow down. A sluggish jet stream would mean slower-moving storms that could dump heavier loads of rain and snow, especially in coastal areas.

Preliminary research by Jennifer Francis of Rutgers University suggests that the jet stream’s west-to-east winds have slowed and grown wavier since 1979 because of the loss of Arctic sea ice. Francis has argued that the changes may have contributed to extreme weather events in recent years by creating large dips or kinks in the jet stream—what meteorologists call “blocking” patterns.

Blocking patterns are areas of persistently high pressure that often accompany extreme weather. It was a blocking high, for example, that led to long-lived downpours and devastating flooding in Pakistan in 2010. And it was a similar persistent blocking pattern that caused record melting in Greenland in the summer of 2012 and helped push Superstorm Sandy inland rather than out to sea

- NASA

Part 4 to be published on the 12 March 2013.

Amplified Greenhouse Effect Shifts North's Growing Seasons

March 10, 2013: Vegetation growth at Earth's northern latitudes increasingly resembles lusher latitudes to the south, according to a NASA-funded study based on a 30-year record of ground-based and satellite data sets.

In a paper published Sunday, March 10, in the journal Nature Climate Change, an international team of university and NASA scientists examined the relationship between changes in surface temperature and vegetation growth from 45 degrees north latitude to the Arctic Ocean. Results show temperature and vegetation growth at northern latitudes now resemble those found 4 degrees to 6 degrees of latitude farther south as recently as 1982.

"Higher northern latitudes are getting warmer, Arctic sea ice and the duration of snow cover are diminishing, the growing season is getting longer and plants are growing more," said Ranga Myneni of Boston University's Department of Earth and Environment. "In the north's Arctic and boreal areas, the characteristics of the seasons are changing, leading to great disruptions for plants and related ecosystems."


Of the 10 million square miles (26 million square kilometers) of northern vegetated lands, 34 to 41 percent showed increases in plant growth (green and blue), 3 to 5 percent showed decreases in plant growth (orange and red), and 51 to 62 percent showed no changes (yellow) over the past 30 years. Satellite data in this visualization are from AVHRR and MODIS. Credit: NASA's Goddard Space Flight Center Scientific Visualization Studio 
 
Myneni and colleagues used satellite data to quantify vegetation changes at different latitudes from 1982 to 2011. Data used in this study came from NOAA's Advanced Very High Resolution Radiometers (AVHRR) onboard a series of polar-orbiting satellites and NASA's Moderate Resolution Imaging Spectroradiometer (MODIS) instruments on the Terra and Aqua satellites.

As a result of enhanced warming and a longer growing season, large patches of vigorously productive vegetation now span a third of the northern landscape, or more than 3.5 million square miles (9 million square kilometers). That is an area about equal to the contiguous United States. This landscape resembles what was found 250 to 430 miles (400 to 700 kilometers) to the south in 1982.

"It's like Winnipeg, Manitoba, moving to Minneapolis-Saint Paul in only 30 years," said co-author Compton Tucker of NASA's Goddard Space Flight Center in Greenbelt, Md.
The Arctic's greenness is visible on the ground as an increasing abundance of tall shrubs and trees in locations all over the circumpolar Arctic. Greening in the adjacent boreal areas is more pronounced in Eurasia than in North America.

An amplified greenhouse effect is driving the changes, according to Myneni. Increased concentrations of heat-trapping gasses, such as water vapor, carbon dioxide and methane, cause Earth's surface, ocean and lower atmosphere to warm. Warming reduces the extent of polar sea ice and snow cover, and, in turn, the darker ocean and land surfaces absorb more solar energy, thus further heating the air above them.

"This sets in motion a cycle of positive reinforcement between warming and loss of sea ice and snow cover, which we call the amplified greenhouse effect," Myneni said. "The greenhouse effect could be further amplified in the future as soils in the north thaw, releasing potentially significant amounts of carbon dioxide and methane."

To find out what is in store for future decades, the team analyzed 17 climate models. These models show that increased temperatures in Arctic and boreal regions would be the equivalent of a 20-degree latitude shift by the end of this century relative to a period of comparison from 1951-1980. However, researchers note that plant growth in the north may not continue on its current trajectory. The ramifications of an amplified greenhouse effect, such as frequent forest fires, outbreak of pest infestations and summertime droughts, may slow plant growth. Also, warmer temperatures alone in the boreal zone do not guarantee more plant growth, which also depends on the availability of water and sunlight.

"Satellite data identify areas in the boreal zone that are warmer and dryer and other areas that are warmer and wetter," said co-author Ramakrishna Nemani of NASA's Ames Research Center in Moffett Field, Calif. "Only the warmer and wetter areas support more growth."

"We found more plant growth in the boreal zone from 1982 to 1992 than from 1992 to 2011, because water limitations were encountered in the later two decades of our study," said co-author Sangram Ganguly of the Bay Area Environmental Research Institute and NASA Ames.

Data, results and computer codes from this study will be made available on NASA Earth Exchange (NEX), a collaborative supercomputing facility at Ames Research Center, Moffett Field, Calif. NEX is designed to bring scientists together with data, models and computing resources to accelerate research and innovation and provide transparency.

Author: Kathryn HansenProduction editor: Dr. Tony Phillips | Credit: Science@NASA

Friday, 8 March 2013

In a Warming World, Storms May Be Fewer but Stronger (Part 2)


Storms are Getting Stronger

What exactly does it mean for storms to get “stronger”? Does it mean faster winds? A larger wind field? Lower pressure at the center? More rain and snowfall? Higher storm surges?

“You have to remember that storms aren’t one-dimensional,” says Del Genio. “There are many types of storms, and sorting out how aspects of each type respond to warming is where the science really gets interesting.”


As Sandy was moving up the U.S. East Coast, unusually warm ocean temperatures allowed the storm to stay strong after it left tropical waters. (Map by Robert Simmon, using data from the NOAA Earth System Research Laboratory.)

Rising sea levels exacerbated Sandy’s storm surge, for example, a direct link between global warming and storm damage. And abnormally high sea surface temperatures in the Atlantic probably intensified the storm. But pinning all of Sandy’s fury—its hybrid nature, the scale of its winds, its unusual track—on global warming is premature, says Shepherd, the current president of the American Meteorological Society.

Weather forecasters use terms like snowstorms, derechos, hailstorms, rainstorms, blizzards, low-pressure systems, lightning storms, hurricanes, typhoons, nor‘easters, and twisters. Research meteorologists and climatologists have a simpler way of dividing up the world’s storms: thunderstorms, tropical cyclones, and extra-tropical cyclones. All are atmospheric disturbances that redistribute heat and produce some combination of clouds, precipitation, and wind.


Tropical cyclones, extra-tropical cyclones, and thunderstorms are the three fundamental types of storms studied by the climate change community. (Image ©2013 EUMETSAT.)

Thunderstorms are the smallest type, and they are often part of the larger storm systems (tropical and extra-tropical cyclones). All storms require moisture, energy, and certain wind conditions to develop, but the combination of ingredients varies depending on the type of storm and local meteorological conditions.

For example, thunderstorms form when a trigger—a cold front, converging near-surface winds, or rugged topography—destabilizes a mass of warm, humid air and causes it to rise. The air expands and cools as it ascends, increasing the humidity until the water vapor condenses into liquid droplets or ice crystals in precipitation-making clouds. The process of converting water vapor into liquid water or ice releases latent heat into the atmosphere. (If this doesn’t make sense, remember that the reverse—turning liquid water into water vapor by boiling it—requires heat).

Storms feed off of latent heat, which is why scientists think global warming is strengthening storms. Extra heat in the atmosphere or ocean nourishes storms; the more heat energy that goes in, the more vigorously a weather system can churn.


Thunderstorms derive their energy from the heat released by the condensation of water vapor. This “latent heat” energy drives thunderstorm clouds high into the atmosphere. Thunderstorms dissipate when the cold downdraft created by falling rain drops stifles rising warm air. (Image adapted from NOAA National Weather Service Life Cycle of a Thunderstorm.)

Already, there is evidence that the winds of some storms may be changing. A study based on more than two decades of satellite altimeter data (measuring sea surface height) showed that hurricanes intensify significantly faster now than they did 25 years ago. Specifically, researchers found that storms attain Category 3 wind speeds nearly nine hours faster than they did in the 1980s. Another satellite-based study found that global wind speeds had increased by an average of 5 percent over the past two decades.

There is also evidence that extra water vapor in the atmosphere is making storms wetter. During the past 25 years, satellites have measured a 4 percent rise in water vapor in the air column. In ground-based records, about 76 percent of weather stations in the United States have seen increases in extreme precipitation since 1948. One analysis found that extreme downpours are happening 30 percent more often. Another study found that the largest storms now produce 10 percent more precipitation.


Increases in global temperature have raised atmospheric humidity. (Graph by Robert Simmon, based on data from the NOAA National Climatic Data Center.)

William Lau, a scientist at NASA’s Goddard Space Flight Center, concluded in a 2012 paper that rainfall totals from tropical cyclones in the North Atlantic have risen at a rate of 24 percent per decade since 1988. The increase in precipitation doesn’t just apply to rain. NOAA scientists have examined 120 years of data and found that there were twice as many extreme regional snowstorms between 1961 and 2010 as there were from 1900 to 1960.

But measuring a storm’s maximum size, heaviest rains, or top winds does not capture the full scope of its power. Kerry Emanuel, a hurricane expert at the Massachusetts Institute of Technology, developed a method to measure the total energy expended by tropical cyclones over their lifetimes. In 2005, he showed that Atlantic hurricanes are about 60 percent more powerful than they were in the 1970s. Storms lasted longer and their top wind speeds had increased by 25 percent. (Subsequent research has shown that the intensification may be related to differences between the temperature of the Atlantic and Pacific oceans.)

- NASA

Note: Part 3 to be published 9 March 2013

Thursday, 7 March 2013

Australia - Bureau of Meteorology confirms it's been the hottest summer on record


This summer hasn't just felt hot. It's been hot. The numbers are in, and the Bureau has confirmed this summer has been Australia's hottest on record.

Average temperatures across the country came in at 28.6°C, 1.1°C above normal, and exceeding the previous record set in the summer of 1997-98 by more than 0.1°C. A new daytime maximum temperature record was also set at 35.7°C, or 1.4°C above normal, and 0.2°C above the 1982/83 record.

The most extreme heat occurred in the first three weeks of January during an exceptionally widespread and prolonged heatwave. The highest temperature recorded during the heatwave was at Moomba in South Australia at 49.6°C.

Of the 112 locations used in long-term climate monitoring, 14 had their hottest day on record during the summer of 2012/13 – the largest number in any single summer. Record temperatures were also set in two capital cities; Sydney with 45.8°C and Hobart with 41.8°C.

A new record was also set for the number of consecutive days the average maximum daily temperature for Australia exceeded 39°C – seven days between 2 and 8 January 2013, almost doubling the previous record of four consecutive days in 1973.

Despite heavy rainfall on the east coast, compounded as ex-tropical cyclone Oswald cut a steady path down the eastern-seaboard, for most of Australia it was a dry summer.

Nationally, summer rainfall was at its lowest since 2004-05. Victoria had its driest summer since 1984-85 and South Australia since 1985-86.

This summer follows a pattern of extremely hot summers in various parts of the world over the past few years.

While the final numbers for the Southern Hemisphere summer will not be confirmed until mid-March, it was the hottest December on record for land areas of the Southern Hemisphere, followed by the hottest January. Large parts of southern Africa recorded their hottest January on record.

Hotter temperatures were also recorded in large parts of Argentina, Chile and Brazil, while temperatures in parts of Patagonia were more than 4°C above normal in January.

For further information go to www.bom.gov.au/climate/change/
Also read Hot Summer? Yes: the hottest published today on The Conversation.

- WMO  +  Bureau of Meteorology, Australia.

In a Warming World, Storms May Be Fewer but Stronger (Part 1)

Scientists Investigate How Climate Change Affects Extreme Weather

By Adam Voiland Design by Robert Simmon March 5, 2013
 
Introduction
 
Few images are as beautiful and as terrifying as a satellite view of a hurricane about to make landfall. On October 29, 2012, the Suomi NPP satellite captured an ominous nighttime view of Sandy—an enormous hybrid storm that was part hurricane, part Nor‘easter—churning off the coast of New Jersey.

Hurricane Sandy approaches the Atlantic coast of the U.S. in the early morning hours of October 29, 2012. (NASA Earth Observatory image by Jesse Allen and Robert Simmon, using VIIRS Day-Night Band data from the Suomi National Polar-orbiting Partnership.)

The string of city lights that stretches from Washington to Boston was mostly gone, blanketed by thick, ghostly storm clouds. One of the most brightly lit cities in the world, New York, was little more than a faint smudge through Sandy’s clouds.

In a matter of hours, that smudge of light would go dark. Large swaths of Manhattan were under water. The Rockaways were on fire. Rooftops along the New Jersey shore became temporary islands for people escaping a wall of seawater that surged inland.

Hurricane Sandy knocked out power to much of lower Manhattan, New York. (Photograph ©2012 Several seconds.)

Was Superstorm Sandy an expression of a “new normal” for our weather? Was it a storm pumped up by global warming?

“If you look at the unique set of circumstances in which Sandy emerged and you know something about meteorology and climate,” says Marshall Shepherd, director of the atmospheric sciences program at the University of Georgia, “it’s hard not to ask yourself these kinds of questions.”

Sandy is not the only recent storm to make people ask questions about climate change and weather. In 2010, an epic winter storm dubbed “Snowmageddon” dumped more than half a meter (2 feet) of snow across many parts of the U.S. East Coast. And in April 2011, tornadoes killed more than 364 Americans—the most ever in a month. The rash of twisters etched scars of destruction on the landscape so long and wide that they could be seen from space. The United States set records in 2011 and 2012 for the number of weather disasters that exceeded $1 billion in losses; most were storms.


Hackleburg High School in Alabama was destroyed by a tornado in April 2011. (Photograph courtesy Federal Emergency Management Agency.)

All of these weather events have happened as the concentration of greenhouse gases in the atmosphere has been rising higher than it has been for at least 100,000 years. Scientists are nearly certain that the buildup of carbon dioxide has already sparked changes in Earth’s atmosphere and ecosystems. The lowest layer of the atmosphere (the troposphere) has warmed markedly, especially at high latitudes. So have the world’s oceans. Heat waves and droughts have grown more likely and more extreme. Arctic ice is melting at a record pace, and the snowy landscapes of the far north have started melting earlier each year.

Given all the change that has already take place, it’s reasonable to wonder if climate change has affected storms as well. “After the tornadoes in 2011, I was flooded with calls from reporters,” says Anthony Del Genio, a climatologist at NASA’s Goddard Institute for Space Studies (GISS). “People wanted quick, definitive answers. The trouble is that’s not where the science is.”

Historically, research on tornadoes, hurricanes, and other types of storms has focused on short-term forecasting, not on understanding how storms are changing over time. Reliable, long-term records of storms are scarce, and the different reporting and observing methods have left many scientists and meteorologists feeling skeptical. But the study of storminess and climate has begun to mature, says Del Genio, and a consensus is emerging: for several types of storms, global warming may prime the atmosphere to produce fewer but stronger storms.

- NASA

Storms are Getting Stronger (Part 2) to be published 8 March 2013


Thursday, 17 January 2013

NASA Ozone Study May Benefit Air Standards, Climate


The full version of this story with accompanying images is at:
http://www.jpl.nasa.gov/news/news.php?release=2013-022&cid=release_2013-022

PASADENA, Calif. - A new NASA-led study finds that when it comes to combating global warming caused by emissions of ozone-forming chemicals, location matters.

Ozone is both a major air pollutant with known adverse health effects and a greenhouse gas that traps heat from escaping Earth's atmosphere. Scientists and policy analysts are interested in learning how curbing the emissions of these chemicals can improve human health and also help mitigate climate change.

Research scientists Kevin Bowman of NASA's Jet Propulsion Laboratory, Pasadena, Calif., and Daven Henze of the University of Colorado, Boulder, set out to quantify, down to areas the size of large metropolitan regions, how the climate-altering impacts of these chemical emissions vary around the world. The chemicals, which are produced from sources such as planes, factories and automobiles, are converted to ozone in the presence of sunlight and subsequently transported by wind around our planet. Among these chemicals are nitrogen dioxide, carbon monoxide and non-methane hydrocarbons.

By combining satellite observations of how much heat ozone absorbs in Earth's atmosphere with a model of how chemicals are transported in the atmosphere, the researchers discovered significant regional variability - in some places by more than a factor of 10 -- in how efficiently ozone trapped heat in Earth's atmosphere, depending upon where the ozone-forming chemical emissions were located. This variability was found within individual continents and even among different regions with similar emission levels within individual countries. High-latitude regions such as Europe had a smaller impact than lower-latitude regions like North America. Ozone was observed to be a more efficient greenhouse gas over hot regions like the tropics or relatively cloud-free regions like the Middle East. The satellite data were collected by the Tropospheric Emission Spectrometer instrument on NASA's Aura spacecraft.

"When it comes to reducing ozone levels, emission reductions in one part of the world may drive greenhouse warming more than a similar level of emission reductions elsewhere," said Bowman, lead author of the study, published recently in the journal Geophysical Research Letters. "Where you clean up ozone precursor emissions makes a big difference. It's all about -- to use a real estate analogy -- location, location, location."

Variations in chemicals that lead to the production of ozone are driven by industry and human population. For example, the U.S. Northeast has much higher ozone precursor emission levels than, say, Wisconsin.

"We show that, for example, even though Chicago has a level of ozone precursor emissions three times larger than the levels in Atlanta, reducing emissions by 10 percent in the Atlanta region has the same impact on climate as reducing emissions by 10 percent in Chicago," Bowman added. "This is because Atlanta is a much more efficient place than Chicago for affecting climate through ozone."

The researchers found that the top 15 regional contributors to global ozone greenhouse gas levels were predominantly located in China and the United States, including the regions that encompass New Orleans, Atlanta and Houston.

Bowman and Henze found considerable variability in how different types of emissions contribute to ozone's greenhouse gas effect. For example, compared to all nitrogen dioxide emissions -- both human-produced and natural -- industrial and transportation sources make up a quarter of the total greenhouse gas effect, whereas airplanes make up only one percent. They also found that nitrogen dioxide contributes about two-thirds of the ozone greenhouse gas effect compared to carbon monoxide and non-methane hydrocarbons.

Bowman said the research suggests that solutions to improve air quality and combat climate change should be tailored for the regions in which they are to be executed.

"One question that's getting a lot of interest in policy initiatives such as the United Nations' Environment Programme Climate and Clean Air Coalition is controlling short-lived greenhouse gases like methane and ozone as part of a short-term strategy for mitigating climate change," Bowman said. "Our study could enable policy researchers to calculate the relative health and climate benefits of air pollution control and pinpoint where emission reductions will have the greatest impacts. This wasn't really possible to do at these scales before now. This is particularly important in developing countries like China, where severe air pollution problems are of greater concern to public officials than climate change mitigation in the short term."

"Our study is an important step forward in this field because we've built a special model capable of looking at the effects of location at a very high resolution," said Henze. "The model simulations are based upon actual observations of ozone warming effects measured by NASA's Tropospheric Emission Spectrometer satellite instrument. This is the first time we've been able to separate observed heat trapping due to ozone into its natural versus human sources, and even into specific types of human sources, such as fossil fuels versus biofuels. This information can be used to mitigate climate change while improving air quality."

For more information on TES, visit: http://tes.jpl.nasa.gov . You can follow JPL News on Facebook at: http://www.facebook.com/nasajpl and on Twitter at: http://www.twitter.com/nasajpl .

The California Institute of Technology in Pasadena manages JPL for NASA.

Alan Buis 818-354-0474
Jet Propulsion Laboratory, Pasadena, Calif.
Alan.buis@jpl.nasa.gov

Long-Term Global Warming Trend Continues


Scientists at NASA’s Goddard Institute for Space Studies (GISS) say 2012 was the ninth warmest year since 1880, continuing a long-term trend of rising global temperatures. The ten warmest years in the 132-year record have all occurred since 1998. The last year that was cooler than average was 1976.
The map at the top depicts temperature anomalies, or changes, by region in 2012; it does not show absolute temperature. Reds and blues show how much warmer or cooler each area was in 2012 compared to an averaged base period from 1951–1980. For more explanation of how the analysis works, read World of Change: Global Temperatures.

The average temperature in 2012 was about 14.6 degrees Celsius (58.3 degrees Fahrenheit), which is 0.55°C (1.0°F) warmer than the mid-20th century base period. The average global temperature has increased 0.8°C (1.4°F) since 1880, and most of that change has occurred in the past four decades.
The line plot above shows yearly temperature anomalies from 1880 to 2011 as recorded by NASA GISS, the National Oceanic and Atmospheric Administration (NOAA) National Climatic Data Center, the Japanese Meteorological Agency, and the Met Office Hadley Centre in the United Kingdom. All four institutions tally temperature data from stations around the world and make independent judgments about whether the year was warm or cool compared to other years. Though there are minor variations from year to year, all four records show peaks and valleys in sync with each other. All show rapid warming in the past few decades, and all show the last decade as the warmest.

Scientists emphasize that weather patterns cause fluctuations in average temperatures from year to year, but the continued increase in greenhouse gas levels in the atmosphere assures that there will be a long-term rise in global temperatures. Each individual year will not necessarily be warmer than the previous year, but scientists expect each decade to be warmer than the previous decade.

“One more year of numbers isn’t in itself significant,” GISS climatologist Gavin Schmidt said. “What matters is this decade is warmer than the last decade, and that decade was warmer than the decade before. The planet is warming. The reason it’s warming is because we are pumping increasing amounts of carbon dioxide into the atmosphere.”

Carbon dioxide traps heat and largely controls Earth’s climate. It occurs naturally but is also released by the burning of fossil fuels for energy. The level of carbon dioxide in Earth’s atmosphere has been rising consistently for decades, largely driven by increasing man-made emissions. The carbon dioxide level in the atmosphere was about 285 parts per million in 1880, the first year of the GISS temperature record. By 1960, the atmospheric carbon dioxide concentration, measured at NOAA’s Mauna Loa Observatory, was about 315 parts per million. Today, that measurement exceeds 390 parts per million.

The continental U.S. endured its warmest year on record by far, according to NOAA, the official keeper of U.S. weather records. NOAA also announced that global temperatures were 10th warmeston record by their analysis methods.

“The U.S. temperatures in the summer of 2012 are an example of a new trend of outlying seasonal extremes that are warmer than the hottest seasonal temperatures of the mid-20th century,” NASA GISS director James E. Hansen said. “The climate dice are now loaded. Some seasons still will be cooler than the long-term average, but the perceptive person should notice that the frequency of unusually warm extremes is increasing. It is the extremes that have the most impact on people and other life on the planet.”
  1. References

  2. NASA (2013, January 15) NASA Finds 2012 Sustained Long-Term Climate Warming Trend. Accessed January 15, 2013.
  3. NASA Earth Observatory (n.d.) World of Change: Global Temperatures. Accessed January 15, 2013.
  4. NASA Goddard Institute for Space Studies (n.d.) GISS Surface Temperature Analysis. Accessed January 15, 2013.
  5. NOAA National Climatic Data Center (2013, January 15) State of the Climate: 2012. Accessed January 15, 2013.
NASA images by Robert Simmon, based on data from the NASA Goddard Institute for Space Studies, NOAA National Climatic Data Center, Met Office Hadley Centre/Climatic Research Unit, and the Japanese Meteorological Agency. Caption by Patrick Lynch and Mike Carlowicz.
Instrument: 
In situ Measurement - NASA

Wednesday, 16 January 2013

NASA Finds Long-Term Climate Warming Trend

Jan. 15, 2013: NASA scientists say 2012 was the ninth warmest of any year since 1880, continuing a long-term trend of rising global temperatures. With the exception of 1998, the nine warmest years in the 132-year record all have occurred since 2000, with 2010 and 2005 ranking as the hottest years on record.

NASA's Goddard Institute for Space Studies (GISS) in New York, which monitors global surface temperatures on an ongoing basis, released an updated analysis Tuesday that compares temperatures around the globe in 2012 to the average global temperature from the mid-20th century. The comparison shows how Earth continues to experience warmer temperatures than several decades ago.


Click HERE to view movie. This color-coded map displays a progression of changing global surface temperatures anomalies from 1880 through 2012. The final frame represents global temperature anomalies averaged from 2008 through 2012. More movies

The average temperature in 2012 was about 58.3 degrees Fahrenheit (14.6 Celsius), which is 1.0 F (0.6 C) warmer than the mid-20th century baseline. The average global temperature has risen about 1.4 degrees F (0.8 C) since 1880, according to the new analysis.

Scientists emphasize that weather patterns always will cause fluctuations in average temperature from year to year, but the continued increase in greenhouse gas levels in Earth's atmosphere assures a long-term rise in global temperatures. Each successive year will not necessarily be warmer than the year before, but on the current course of greenhouse gas increases, scientists expect each successive decade to be warmer than the previous decade.

"One more year of numbers isn't in itself significant," GISS climatologist Gavin Schmidt said. "What matters is this decade is warmer than the last decade, and that decade was warmer than the decade before. The planet is warming. The reason it's warming is because we are pumping increasing amounts of carbon dioxide into the atmosphere."

Carbon dioxide is a greenhouse gas that traps heat and largely controls Earth's climate. It occurs naturally and also is emitted by the burning of fossil fuels for energy. Driven by increasing man-made emissions, the level of carbon dioxide in Earth's atmosphere has been rising consistently for decades.

The carbon dioxide level in the atmosphere was about 285 parts per million in 1880, the first year in the GISS temperature record. By 1960, the atmospheric carbon dioxide concentration, measured at NOAA's Mauna Loa Observatory, was about 315 parts per million. Today, that measurement exceeds 390 parts per million.

While the globe experienced relatively warm temperatures in 2012, the continental U.S. endured its warmest year on record by far, according to NOAA, the official keeper of U.S. weather records.


Temperature data sets collected by NASA and NOAA provide independent confirmation of recent warming trends. [more data

"The U.S. temperatures in the summer of 2012 are an example of a new trend of outlying seasonal extremes that are warmer than the hottest seasonal temperatures of the mid-20th century," GISS director James E. Hansen said. "The climate dice are now loaded. Some seasons still will be cooler than the long-term average, but the perceptive person should notice that the frequency of unusually warm extremes is increasing. It is the extremes that have the most impact on people and other life on the planet."

The temperature analysis produced at GISS is compiled from weather data from more than 1,000 meteorological stations around the world, satellite observations of sea-surface temperature, and Antarctic research station measurements. A publicly available computer program is used to calculate the difference between surface temperature in a given month and the average temperature for the same place during 1951 to 1980. This three-decade period functions as a baseline for the analysis. The last year that experienced cooler temperatures than the 1951 to 1980 average was 1976.

The GISS temperature record is one of several global temperature analyses, along with those produced by the Met Office Hadley Centre in the United Kingdom and the National Oceanic and Atmospheric Administration's National Climatic Data Center in Asheville, N.C. These three primary records use slightly different methods, but overall, their trends show close agreement.

 Production editor: Dr. Tony Phillips | Credit: Science@NASA

Monday, 14 January 2013

Monthly heat records have increased fivefold


The Redbank North Fire burns close to the Newell Hwy near Coonabarabran, about 350km north west of Sydney, in this handout picture provided by the Rural Fire Service on January 14, 2013. Image by: HANDOUT / REUTERS

Global warming has caused monthly records for heat to increase fivefold in frequency, according to a study by scientists in Germany and Spain, published on Monday.

In parts of Europe, Africa and southern Asia, the frequency of months with record-breaking heat has surged tenfold, it said.

The evidence comes from an analysis of 131 years of monthly temperature data, monitored at 12,000 points around the world, which are stored in a NASA database.

If man-made warming is stripped out of the equation, 80 percent of the records for hottest-ever months would not have occurred, it said.

"The last decade brought unprecedented heatwaves, for instance in the US in 2012, in Russia in 2010, in Australia in 2009 and in Europe in 2003," said Dim Coumou of the Potsdam Institute for Climate Impact Research near Berlin.

On current trends for global warming, the number of new monthly heat records will be 12 times higher in 30 years than today, the researchers said.

"This doesn't mean there will be 12 times more hot summers in Europe than today -- it actually is worse," Coumou said in a press release issued by PIK.

"To count as new records, they actually have to beat heat records set in the 2020s and 2030s, which will already be hotter than anything we have experienced to date."

The study, which was co-authored by scientists at the Complutense University of Madrid, appears in the journal Climatic Change.

- Times Live

Friday, 11 January 2013

2012 was warmest and second most extreme year on record for the contiguous U.S.

2012 was a historic year for extreme weather that included drought, wildfires, hurricanes and storms; however, tornado activity was below average

2012 marked the warmest year on record for the contiguous United States with the year consisting of a record warm spring, second warmest summer, fourth warmest winter and a warmer-than-average autumn. The average temperature for 2012 was 55.3°F, 3.2°F above the 20th century average, and 1.0°F above 1998, the previous warmest year.

The average precipitation total for the contiguous U.S. for 2012 was 26.57 inches, 2.57 inches below average, making it the 15th driest year on record for the nation. At its peak in July, the drought of 2012 engulfed 61 percent of the nation with the Mountain West, Great Plains, and Midwest experiencing the most intense drought conditions. The dry conditions proved ideal for wildfires in the West, charring 9.2 million acres — the third highest on record.

The U.S. Climate Extremes Index indicated that 2012 was the second most extreme year on record for the nation. The index, which evaluates extremes in temperature and precipitation, as well as landfalling tropical cyclones, was nearly twice the average value and second only to 1998. To date, 2012 has seen 11 disasters that have reached the $1 billion threshold in losses, to include Sandy, Isaac, and tornado outbreaks experienced in the Great Plains, Texas and Southeast/Ohio Valley.


Note: The Annual Climate Report for the United States has several pages of supplemental information and data regarding some of the exceptional events 2012.

U.S. temperature

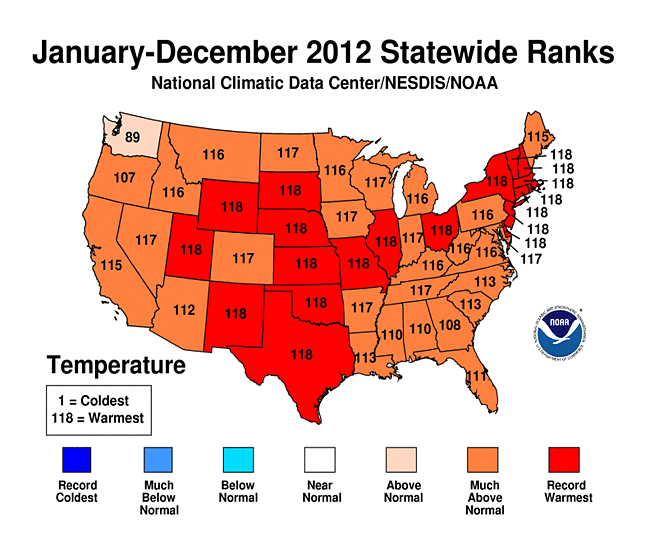
  • 2012 Statewide Temperature Ranks Map
    2012 Statewide Temperature (top) ranks
    Every state in the contiguous U.S. had an above-average annual temperature for 2012. Nineteen states had a record warm year and an additional 26 states had one of their 10 warmest.
  • On the national scale, 2012 started off much warmer than average with the fourth warmest winter (December 2011-February 2012) on record. Winter warmth limited snow with many locations experiencing near-record low snowfall totals. The winter snow cover for the contiguous U.S. was the third smallest on record and snowpack totals across the Central and Southern Rockies were less than half of normal.
  • Spring started off exceptionally warm with the warmest March on record, followed by the fourth warmest April and second warmest May. The season’s temperature was 5.2°F above average, making it easily the warmest spring on record, surpassing the previous record by 2.0°F. The warm spring resulted in an early start to the 2012 growing season in many places, which increased the loss of water from the soil earlier than what is typical. In combination with the lack of winter snow and residual dryness from 2011, the record warm spring laid the foundation for the widespread drought conditions in large areas of the U.S. during 2012.
  • The above-average temperatures of spring continued into summer. The national-scale heat peaked in July with an average temperature of 76.9°F, 3.6°F above average, making it the hottest month ever observed for the contiguous United States. The eighth warmest June, record hottest July, and a warmer-than-average August resulted in a summer average temperature of 73.8°F, the second hottest summer on record by only hundredths of a degree. An estimated 99.1 million people experienced 10 or more days of summer temperatures greater than 100°F, nearly one-third of the nation’s population.
  • Autumn and December temperatures were warmer than average, but not of the same magnitude as the three previous seasons. Autumn warmth in the western U.S. offset cooler temperatures in the eastern half of the country. Although the last four months of 2012 did not bring the same unusual warmth as the first 8 months of the year, the September through December temperatures were warm enough for 2012 to remain the record warmest year by a wide margin. 

U.S. precipitation

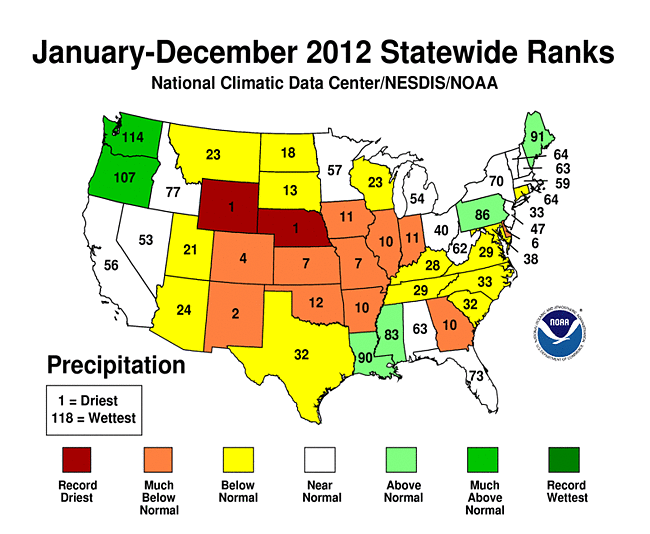
  • The nationally-averaged precipitation total of 26.57 inches was 2.57 inches below average and the 15th driest year on record for the lower 48. This was also the driest year for the nation since 1988 when 25.25 inches of precipitation was observed.
    2012 Statewide Precipitation Ranks Map 2012 Precipitation ranks
  • Each season of 2012 had precipitation totals below the 20th century average:
    • Winter brought below-average precipitation to both coasts and above-average precipitation to the Southern Plains, slightly lessening drought conditions that plagued the region in 2011. The winter precipitation total was 89 percent of normal.
    • Spring precipitation was 95 percent of the 20th century average with below-average precipitation in the Rockies and Midwest and above-average precipitation in the Northwest and Upper Midwest.
    • Summer precipitation was 88 percent of normal with dry conditions in the central United States. The West Coast, Gulf Coast, and Northeast were wetter than average.
    • Autumn was drier than average for most of the central U.S., with wet conditions in the Northwest, Ohio Valley, and Northeast. The autumn precipitation total was 85 percent of average.

Alaska and Hawaii

  • Alaska was cooler and slightly wetter than average during 2012. The year began very cold for the state with a January temperature 14.0°F below the 1971-2000 average. Each subsequent season was also cooler than average, resulting in an annual temperature 2.3°F below average. Much of 2012 was also wetter than average, and the annual precipitation total was 9.2 percent above average.
  • Drought conditions continued to plague Hawaii during 2012. At the beginning of 2012, 47.4 percent of the state was experiencing moderate-to-exceptional drought, according to the U.S. Drought Monitor. By the end of the year, the percent area experiencing moderate-to-exceptional drought expanded to 63.3 percent of the state.

Significant weather and climate events

Significant U.S. Climate Events for November 2012
Significant weather and climate events for 2012.
Click image to enlarge, or click here for the National Overview.
  • Tropical cyclone activity across the North Atlantic in 2012 as above-average with 19 named storms, ten hurricanes, and one major hurricane (Category 3 or stronger). This is the third consecutive North Atlantic tropical cyclone season with 19 named storms and ties with as the third most active season for the basin. Isaac and Sandy made landfall along the U.S. coast during 2012 causing significant impacts. Isaac brought large storm surge and torrential rains to the Gulf Coast. Sandy caused significant damage to the Northeast, with 8 million homes losing power and 131 fatalities reported.
  • The widespread drought conditions of 2012 peaked in July with approximately 61 percent of the country experiencing drought conditions. The footprint of drought during 2012 roughly equaled the drought of the 1950s which peaked at approximately 60 percent. The size of the current drought and the drought of the 1950s are smaller than the drought episodes of the 1930s. The current drought has yet to reach the intensity or duration of the 1950s and 1930s national-scale droughts.
  • Wildfire activity during 2012 was above-average with 9.2 million acres burned the third most in the 13-year record. Numerous large and destructive wildfires impacted the western U.S. throughout the year. The Waldo Canyon fire near Colorado Springs, Colorado destroyed nearly 350 homes and was the most destructive fire on record for the state. The Whitewater-Baldy Complex fire charred nearly 300,000 acres and was the largest on record for New Mexico.
  • Tornado activity during 2012 was below the 1991-2010 average of approximately 1,200. The year got off to a busy start with large tornado outbreaks in March and April causing significant damage in the Ohio Valley and Central Plains. May and June, typically the most active tornado months of the year, both had less than half of average tornado counts. The final 2012 tornado count will likely be less than 1,000 — the least since 2002.


Overview

The State of the Climate Report is a collection of monthly summaries recapping climate-related occurrences on both a global and national scale. The report is composed of the following sections:

Thursday, 20 December 2012

New NASA-funded system helps flights avoid storms


An astronaut photo showing a series of mature thunderstorms located near the Parana River in southern Brazil. Image credit: NASA

A new NASA-funded prototype system developed by the National Center for Atmospheric Research (NCAR) of Boulder, Colo., now is providing weather forecasts that can help flights avoid major storms as they travel over remote ocean regions. The eight-hour forecasts of potentially dangerous atmospheric conditions are designed for pilots, air traffic controllers and others involved in transoceanic flights.

The NCAR-based system combines satellite data and computer weather models to produce maps of storms over much of the world's oceans. The system is based on products that NCAR has developed to alert pilots and air traffic controllers about storms and related hazards, such as turbulence and lightning, over the continental United States. Development of the forecasts was spurred in part by the 2009 crash of Air France Flight 447, which encountered a complex of thunderstorms over the Atlantic Ocean.

The system was funded by NASA's Applied Sciences Program, which supports efforts to discover and demonstrate innovative and practical uses of NASA Earth science and satellite observations. NCAR worked with the Massachusetts Institute of Technology's Lincoln Laboratory, the Naval Research Laboratory, and the University of Wisconsin-Madison to create the system.

"These new forecasts can help fill an important gap in our aviation system," said NCAR's Cathy Kessinger, lead researcher on the project. "Pilots have had limited information about atmospheric conditions as they fly over the ocean, where conditions can be severe. By providing them with a picture of where significant storms will be during an eight-hour period, the system can contribute to both the safety and comfort of passengers on flights."

The forecasts, which continue to be tested and modified, cover most of the Atlantic and Pacific oceans, where NCAR has real-time access to geostationary satellite data. The forecasts are updated every three hours.

Pilots of transoceanic flights currently get preflight briefings and, in certain cases involving especially intense storms, in-flight weather updates every four hours. They also have onboard radar, but that information is of limited value for strategic flight planning while en route.

"Turbulence is the leading cause of injuries in commercial aviation," said John Haynes, Applied Sciences Program manager at NASA Headquarters in Washington. "This prototype system is of crucial importance to pilots and is another demonstration of the practical benefit of NASA's Earth observations."

Pinpointing turbulence associated with storms over the oceans is far more challenging than it is over land because geostationary satellites, unlike ground-based radar, cannot see within the clouds. Thunderstorms may develop quickly and move rapidly, rendering the briefings and weather updates obsolete. Onboard radars lack the power to see long distances or through dense clouds.

As a result, pilots often must choose between detouring hundreds of miles around potentially stormy areas or flying directly through a region that may or may not contain intense weather. Storms may be associated with hazardous windshear and icing conditions in addition to lightning, hail and potentially severe turbulence.

To create the forecasts, Kessinger and her colleagues first turned to geostationary satellite measurements to identify regions of the atmosphere that met two conditions: particularly high cloud tops and water vapor at high altitudes. These two conditions are a sign of powerful storms and strong updrafts that can buffet an aircraft. The scientists next used fuzzy logic and data fusion techniques to home in on storms of particular concern, and applied object tracking techniques and simulations of wind fields to predict storm locations at hourly intervals out to eight hours.

Researchers verified the forecasts using a variety of data from NASA Earth observations, including the Tropical Rainfall Measuring Mission (TRMM) satellite.

"These advanced techniques enable us to inform pilots about the potential for violent downdrafts and turbulence, even over the middle of the ocean where we don't have land-based radar or other tools to observe storms in detail," Kessinger said.

By Steve Cole,
NASA Headquarters